Kerry Emanuel has said lots of lies about the ClimateGate. Otherwise, the contributions by Scott Armstrong, John Christy, and Richard Muller made lots of sense. Peter Glaser and David Montgomery added a more economically oriented skeptical perspective.

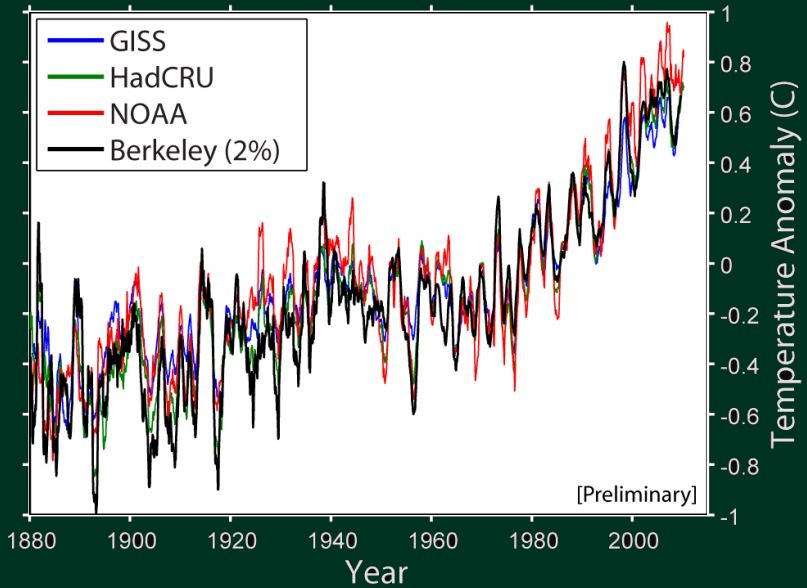
Click to zoom in. Taken from BEST.
Richard Muller has presented preliminary results of the Berkeley Earth Surface Temperature (BEST). Let me say that I am utterly disappointed by the reality of the transparency that's been promised to us. In fact, BEST hasn't offered anything at all - even though it's already presenting its result to the U.S. Congress. I can't even get a single page of the overall data.
I am still waiting to download a few gigabytes with all the raw data - plus all the algorithms that realize their promised quality standards (so far many of them haven't been done).
On the other hand, unless Richard Muller is totally lying to the U.S. politicians, the graph above shows that it is pretty much unthinkable that a different analysis or selection of the weather stations would eliminate or radically modify the 20th century warming.
Two percent of the stations were randomly chosen, he claims, and the result still pretty much agrees with HadCRUT3 and others. Although I deeply appreciate the work by some of the famous volunteers, it seems very clear that their findings about the problems with the particular weather stations etc. can't have a noticeable effect on the major 20th century temperature trends.
I may have been "somewhat uncertain" about the 20th century warming in the past (I would have said that the odds that the fixes would eliminate the warming were about 1%) but I am not really uncertain now (the probability that those 0.8 °C or so seen in the surface records are artifacts of errors is smaller than 10^{-6}). Still, the risk 10^{-6} or so can't be reduced: if the warming is normally distributed as 0.75 +- 0.15 °C or so, the probability that the right figure is negative is a 5-sigma effect, so around 10^{-6}.
Regional uncertainties will remain larger but the average temperature in the places where weather stations have existed behaves just like the HadCRUT3 graphs and others have been indicating. And it even seems that the urbanization effects can't have a noticeable impact on the reconstructed global temperature because the random "urban signal" depending on the 2% selection would have to be larger.
On the other hand, the attribution and projections are an entirely different issue. It is very clear that some people will try to abuse the looming BEST press releases to promote the (catastrophic) anthropogenic global warming, which surely doesn't follow from the graphs at all. We should be kind of ready to point out those propagandistic tricks as they will occur.
(Also, a confirmation of the record from 1880 is surely no confirmation of the millennium reconstructions.)
Yesterday in the Congress, I liked an intervention of Scott Armstrong. A politician said that all the witnesses agreed that "global warming is happening". That's a very subtle and deliberately vague sentence! At the very end of the session, Scott Armstrong went through the hassle to point out that he disagreed that it "is" happening. It "was" happening in some periods in the past but what "will be" happening in the future is a different matter and an uncertain one.
Many laymen have a "short circuit" in their brains when they automatically assume that the apparent trends from the past may be extrapolated. But the trends in the previous 100 years and the next 100 years are totally different quantities. Moreover, if the same trend continued for 100 years, nothing bad would happen and the temperature change would still remain closer to zero than to the IPCC predictions (even their lower end).